Photo by Giorgio Tomassetti on Unsplash
當手上有一份數據資料要進行分析,這時候如果是使用Pandas套件,通常會利用describe()方法(Method),來初步瞭解資料內容,但是對於想要深入分析資料集來說,資訊還不夠充足。
所以本文就以Kaggle網站的「Netflix data with IMDB scores added」資料集(mycsvfile.csv)為例,來和大家分享一個很常用來進行探索式資料分析(Exploratory Data Analysis)的套件-Pandas Profiling,能夠將Pandas DataFrame中儲存的資料,產製為一個互動式的網頁報表,並且以視覺化的方式呈現詳細的資料結構。其中的重點包含:
- 安裝Pandas Profiling套件
- 產製Pandas Profiling報表
- Pandas Profiling報表內容
一、安裝Pandas Profiling套件
首先,利用以下指令安裝Pandas Profiling套件:
$ pip install pandas-profiling[notebook]
二、產製Pandas Profiling報表
安裝完成後,引用pandas及pandas_profiling中的ProfileReport模組(Module),如下範例:
import pandas as pd
from pandas_profiling import ProfileReport
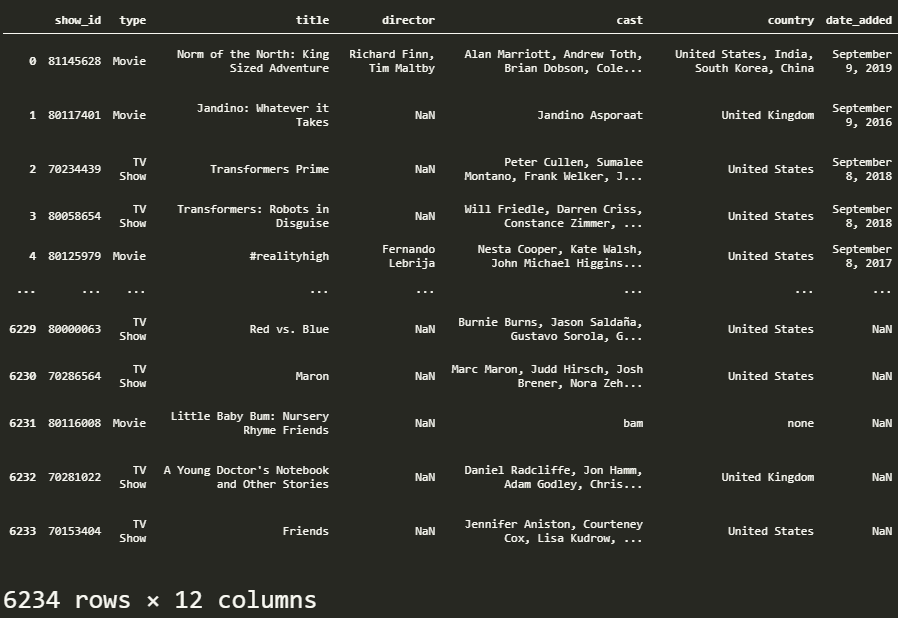
接下來呼叫Pandas套件的read_csv()方法(Method)來讀取Kaggle網站的「Netflix data with IMDB scores added」資料集(mycsvfile.csv),如下範例:
import pandas as pd
from pandas_profiling import ProfileReport


df = pd.read_csv('mycsvfile.csv')
print(df)
擷取部分執行結果
有了Pandas DataFrame資料集,就可以透過Pandas Profiling模組(Module)來建立ProfileReport報表,如下範例:
import pandas as pd
from pandas_profiling import ProfileReport


df = pd.read_csv('mycsvfile.csv')

profile = ProfileReport(df, title='Netflix Profile Report', explorative=True)
print(profile)
擷取部分執行結果
其中的報表內容,會依據資料集的特性,動態產生相關的報表區塊,以本文所使用的「Netflix data with IMDB scores added」資料集(mycsvfile.csv)為例,包含了六個區塊,在下一節會依序來和大家進行詳細介紹。
另外,如果想要將這份互動式網頁報表另存為HTML檔,分享給其他使用者,則可以使用Pandas Profiling模組(Module)的to_file()方法(Method),如下範例:
import pandas as pd
from pandas_profiling import ProfileReport


df = pd.read_csv('mycsvfile.csv')

profile = ProfileReport(df, title='Netflix Profile Report', explorative=True)

profile.to_file('NetflixProfileReport.html')
三、Pandas Profiling報表內容
在Pandas ProfileReport報表中,包含了六個區塊:
- Overview:提供資料分析人員快速瀏覽資料集的變數個數、遺失值比率、重複值比率與變數型態等,如下圖:
而在warnings頁籤則會指出哪些欄位是High cardinality(多唯一值的)、High correlation(高相關性的)及Missing(遺失值比率較高)等。
- Variables:顯示資料集的各個欄位變數統計資訊,除此之外,還可以點擊右下角的「Toggle details」按鈕查看更詳細的欄位資訊。
- Interactions:透過切換頁籤的方式,來瞭解高相關性的不同欄位之間交互關係。
- Correlations:提供Pearson、Spearman、Kendall及Phik四種圖表來顯示高相關性的欄位,如下圖:
- Missing values:顯示遺失值的個數、矩陣、熱力圖和樹狀圖,如下圖:
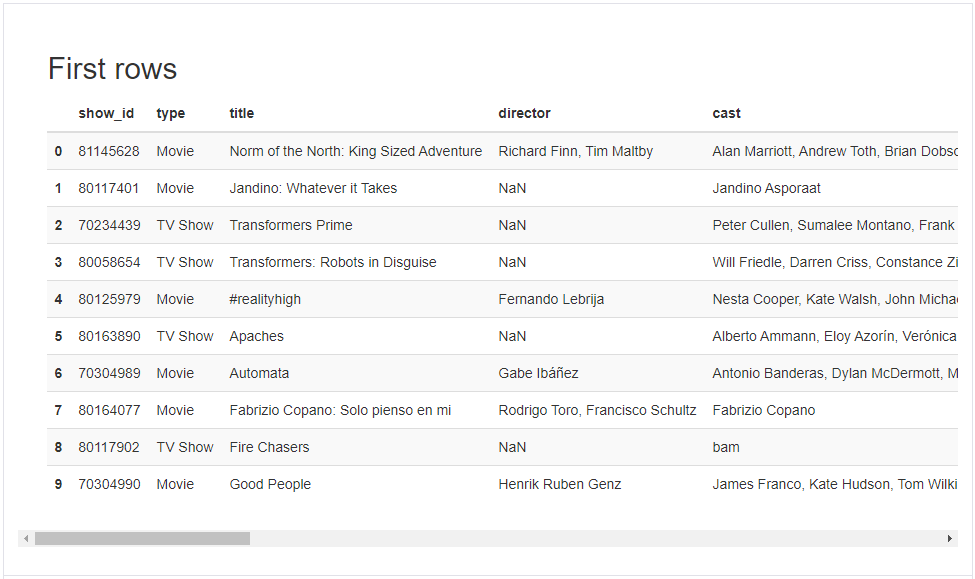
- Sample:顯示資料集的前10筆資料與最後10筆資料,如下圖:
四、小結
Pandas Profiling是一個非常強大的開放原始碼套件,可以使用最少的程式碼快速實現探索式資料分析(EDA),並且透過報表提供的統計數據和視覺化圖表,能夠幫助資料分析人員對於陌生資料集的有效分析和探索,非常值得列為資料分析的工具之一,希望今天的分享對大家有所幫助。
如果喜歡我的文章,別忘了在下面訂閱本網站,以及幫我按五下Like(使用Google或Facebook帳號免費註冊),支持我創作教學文章,回饋由LikeCoin基金會出資,完全不會花到錢,感謝大家。
- [Pandas教學]利用Pandas套件的to_html方法在網頁快速顯示資料分析結果
- [Pandas教學]4個必學的Pandas套件處理遺漏值(Missing Value)資料方法
- [Pandas教學]有效利用Pandas套件的pipe方法打造資料處理流程管道
- [Pandas教學]3個優化Pandas套件讀取大型CSV檔案資料的技巧
- [Pandas教學]一定要學會的Pandas套件讀寫Google Sheets試算表資料秘訣
- [Pandas教學]客製化Pandas DataFrame樣式提升資料可讀性的實用方法
- [Pandas教學]3個Pandas套件合併多個CSV檔案資料的實用技巧
- Pandas教學]看完這篇就懂Pandas套件如何即時讀取API的回應資料
- [Pandas教學]快速掌握Pandas套件讀寫SQLite資料庫的重要方法
- [Pandas教學]輕鬆入門3個常見的Pandas套件排序資料方式
- [Pandas教學]有效利用Pandas套件篩選資料的應用技巧
- [Pandas教學]善用Pandas套件的Groupby與Aggregate方法提升資料解讀效率
- [Pandas教學]使用Pandas套件實作資料清理的必備觀念(上)
- [Pandas教學]使用Pandas套件實作資料清理的必備觀念(下)
- Visual Studio Code漂亮印出Pandas DataFrame資料的實用方法
- [Pandas教學]資料視覺化必懂的Pandas套件繪製Matplotlib分析圖表實戰
- [Pandas教學]5個實用的Pandas讀取Excel檔案資料技巧
- 解析Python網頁爬蟲如何有效整合Pandas套件提升資料處理效率
- [Pandas教學]掌握Pandas DataFrame讀取網頁表格的實作技巧
- [Pandas教學]資料分析必懂的Pandas DataFrame處理雙維度資料方法
- [Pandas教學]資料分析必懂的Pandas Series處理單維度資料方法


你好,很感謝你的教學。我試了你的code後,得到這樣的錯誤訊息
回覆刪除ImportError: cannot import name 'ProfileReport' from partially initialized module 'pandas_profiling' (most likely due to a circular import)
我查網路的解法重安裝pandas-profiling
pip uninstall pandas_profiling
pip install https://github.com/pandas-profiling/pandas-profiling/archive/master.zip
但還是得到一樣的錯誤。
想請問你知不知道是哪裡出了問題,謝謝。
完整指令是pip install pandas-profiling[notebook]
刪除因為沒有輸入[notebook]唷
一樣遇到無法import pandas_profiling的問題。
回覆刪除也用了上面的方式,但問題仍在。
想知道原因跟解法。
完整指令是pip install pandas-profiling[notebook]
刪除因為沒有輸入[notebook]唷